Figure 1: Image of Test Site with Mounted System
| Current Prototype | Third Prototype | Second Prototype | First Prototype |
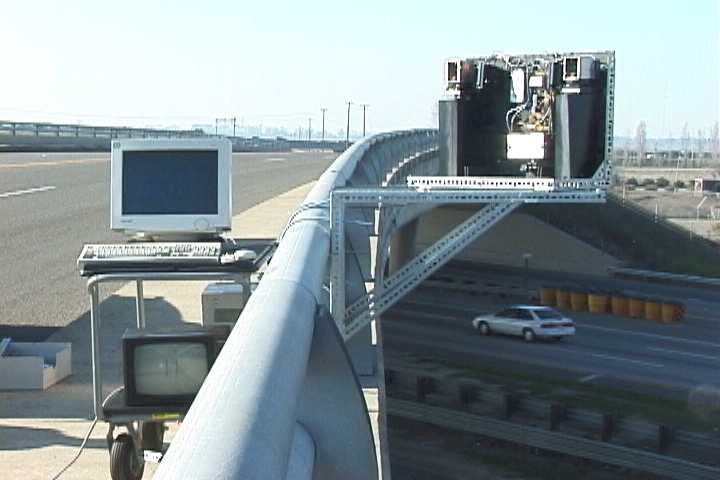
Field tests have been made on a highway with real traffic. Figure 1 is an image of the test site and the detection system mounted on the bridge across the highway.
Figure 1: Image of Test Site with Mounted System
In the current phase, only four of twenty-four elements
of each photodiode array were used for testing. The front and rear speeds,
length and acceleration were obtained in the tests. The sampling rate of
data acquisition is 10 kHz. Figure 2 through Figure 4 demonstrate the
typical signals and measurements of highway tests for various situations.
Images of the vehicles are also placed in these figures for comparison.
The user interface window is shown on top of each figure.
This window contains a menu bar, a status window and a strip chart. The
menu bar is used to control the system, i.e., to start or stop data acquisition
and to set parameters of the system. The signals from the sensor electronic
circuitry are displayed dynamically in the strip chart, which scrolls from
left to right. The signal is at a high level when a vehicle is not present,
and changes to a low level when a vehicle blocks the laser. This transition
occurs over a time that is much shorter than the sampling interval. Since
all the signals are displayed at the same position, only one signal line
can be seen on the chart when there is no vehicle or a vehicle blocks the
laser lines. We can distinguish signals from different sensor elements
when they change from low to high level, or inversely, at different times.
The front speed (v1), rear speed (v2), acceleration (a), and length (l)
of the vehicle are displayed on the lower part of the window. Each line
corresponds to one pair of sensor elements. Currently we only display four
pairs of sensor elements. As an example, in Figure 2 the front speed,
acceleration, rear speed and length calculated from the first pair of sensor
elements are 66.07 miles/hour, 19102.6 mile/hour2, 67.07 mile/hour and
5.598 meters, respectively (it is to be noted that 1 m/s2 = 8053 mile/hour2).
As shown on the left side of the strip chart in Figure
2, the transition edges for the vehicle front did not occur at the same
time. The differences occur because of the curved front bumper on this
vehicle. Different parts of the curved front bumper hit the laser (which
is planar) at different times. On the other hand, the rear bumpers are
essentially flat in this figure, and the transition edges for the rear
bumpers (in the right side of strip chart) transit up at almost the same
time. These behaviors were observed with other vehicles that had straight
or curved bumpers.
Figure 4 illustrates the signals when a vehicle
was changing lanes. The vehicle did not block completely the signal in
the left pair of sensor diodes, so there were many transitions in the signal
for this pair (this pair corresponds to the third row of vehicle parameters).
The vehicle parameters for other sensor pairs were still accurate.
These results show that the signals for the new field
prototype system are clear and the transition is fast enough for measurement.
The system is consistent in measuring vehicle lengths and speeds. A vehicle
traveling at a representative speed of 65 mile/hour will cross the two
laser lines in about 17.5 ms. As a result, the error caused by the sampling
interval is less than about 1.14%. Misalignment of the laser lines on the
road might also cause some errors, though such errors can be accounted
through system adjustment and calibration.
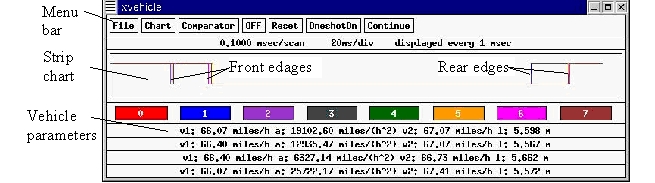
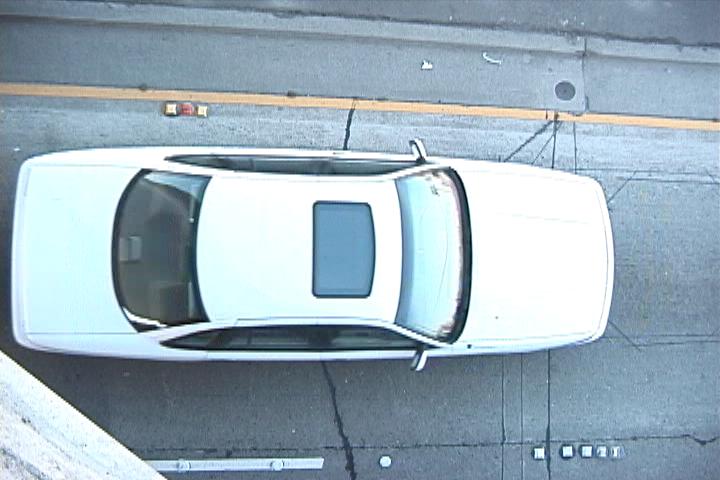
Figure 2: First Example of the System Interface
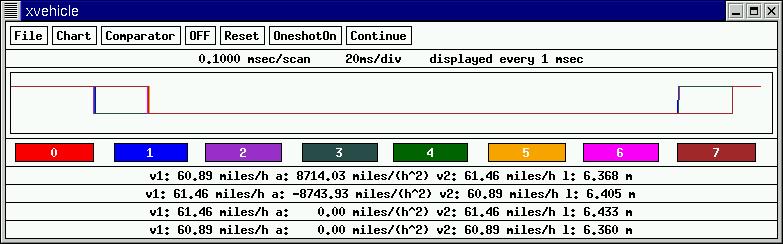
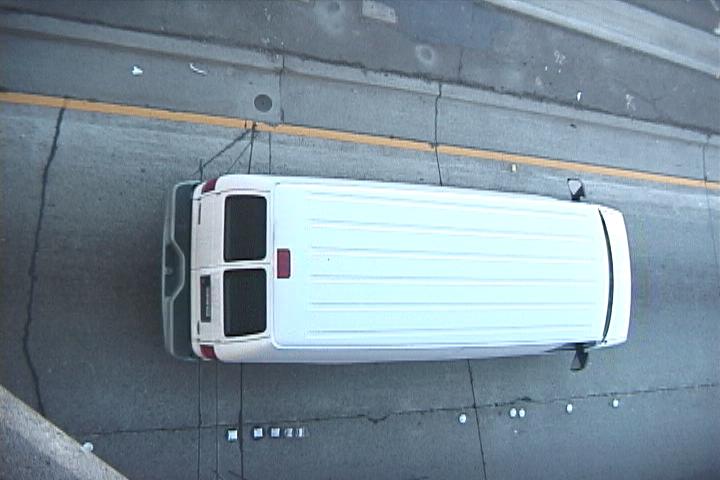
Figure 3: Second Example of the System Interface
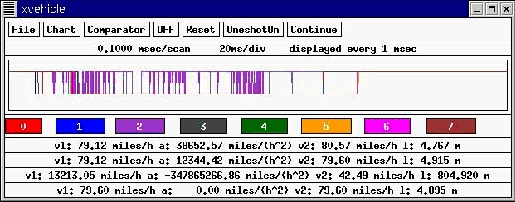
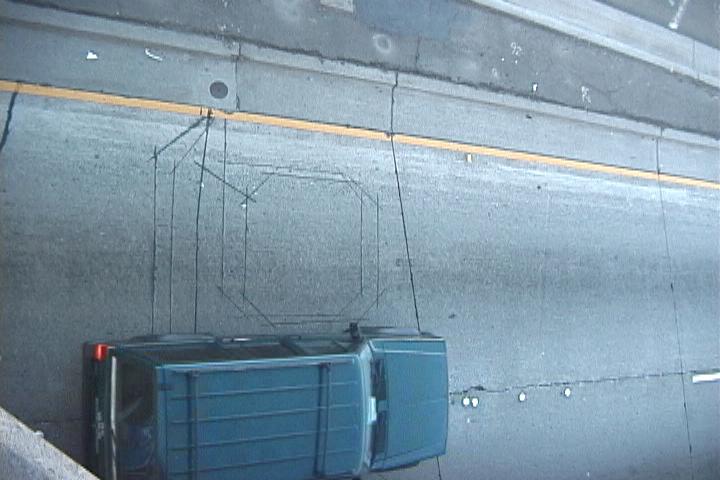
Figure 4: Third Example of the System Interface